Example 1: Building a descriptive table.
example1.RmdSeveral types of statistics (mean, standard deviation, quantiles or frequencies) are displayed according to the nature of each variable (categorical, continuous and normal-distributed or other quantitative type distribution). Also, p-value to test equality between groups is computed using the appropiate test.
Step 1. Install the package
Install the compareGroups package from
CRAN and then load it by typing:
install.packages("compareGroups")
library(compareGroups)
Step 3. Compute descriptives and tests
Compute all descriptives and tests from selected variables by using
the compareGroups function.
Note the
use of formula argument as usual in R, so “.”
indicates all variables in the dataset while “-” sign indicates
removing, and variable on left side of “~” sign indicates the groups (if
descriptives of whole datset without separating by groups is desired
left it in blank). Store the results in an object that can be used
afterwards to perform plots or bivariate table itself.
By the
argument method we set triglycerides
(triglyc), days to cardiovascular event (tocv)
and days until death (todeath) variables to be reported as
median and quartiles instead of mean and standard deviation.
res <- compareGroups(year ~ . - id, data = regicor,
                     method=c(triglyc=2, tocv=2, todeath=2))
Step 4. Create the descriptive table
Use the creaTable function passing the
previous object computed by compareGroups
function (res). Using this function you can customize how
categorical variables are displayed (only percertage or absolute
frequencies or both) by type argument or whether standard
deviation appears inside brackets or separated by plus/minus symbol by
sd.type argument.
Also note the use of
hide.no category which is useful to hide “no” level for
those binary variables.
If you only want to show “Female” category
use hide argument for sex variable indicating
which category is going to be hiden. This argument also applies to
categorical variables with more than two categories. To specify the
number of decimal digits to show use digitsarguments. In
this example height have no decimals and for
weight with three digits. Finally, if you want to show how
many individuals have non-missing values in each described variable, set
show.n argument to TRUE.
restab <- createTable(res, digits = c(height=0, weight=3), type = 1, sd.type = 2,
                      hide = c(sex = "Male"), hide.no = "no", show.n = TRUE)
Step 5. Print or export the descriptive table
Print on R console
The descriptive table can be printed in the R console
using the method print, i.e. just typing the name of the
object:
restab
--------Summary descriptives table by 'Recruitment year'---------

_______________________________________________________________________________________________________________
                                                      1995            2000            2005       p.overall  N
                                                      N=431           N=786          N=1077
¯¯¯¯¯¯¯¯¯¯¯¯¯¯¯¯¯¯¯¯¯¯¯¯¯¯¯¯¯¯¯¯¯¯¯¯¯¯¯¯¯¯¯¯¯¯¯¯¯¯¯¯¯¯¯¯¯¯¯¯¯¯¯¯¯¯¯¯¯¯¯¯¯¯¯¯¯¯¯¯¯¯¯¯¯¯¯¯¯¯¯¯¯¯¯¯¯¯¯¯¯¯¯¯¯¯¯¯¯¯¯
Age                                                 54.1±11.7       54.3±11.2       55.3±10.6      0.078   2294
Sex: Female                                           52.2%           50.4%           53.1%        0.506   2294
Smoking status:                                                                                   <0.001   2233
    Never smoker                                      56.4%           54.6%           52.2%
    Current or former < 1y                            26.3%           35.2%           20.5%
    Former >= 1y                                      17.3%           10.2%           27.4%
Systolic blood pressure                             133±19.2        133±21.3        129±19.8      <0.001   2280
Diastolic blood pressure                            77.0±10.5       80.8±10.3       79.9±10.6     <0.001   2280
History of hypertension                               25.8%           29.6%           35.5%       <0.001   2286
Hypertension treatment                                16.5%           16.2%           22.2%        0.002   2251
Total cholesterol                                   225±43.1        224±44.4        213±45.9      <0.001   2193
HDL cholesterol                                     51.9±14.5       52.3±15.6       53.2±14.2      0.208   2225
Triglycerides                                    94.0 [71.0;136] 98.0 [72.0;133] 98.0 [72.0;139]   0.762   2231
LDL cholesterol                                     152±38.4        149±38.6        136±39.7      <0.001   2126
History of hyperchol.                                 22.5%           33.2%           33.2%       <0.001   2273
Cholesterol treatment                                 6.50%           8.80%           12.8%       <0.001   2239
Height (cm)                                           163±9           162±9           163±9        0.003   2259
Weight (Kg)                                       72.291±12.615   73.842±13.954   73.596±13.869    0.150   2259
Body mass index                                     27.0±4.15       28.1±4.62       27.6±4.63     <0.001   2259
Physical activity (Kcal/week)                        491±419         422±377         351±378      <0.001   2206
Physical component                                  49.3±8.08       49.0±9.63       50.1±8.91      0.032   2054
Mental component                                    49.2±11.3       48.9±11.0       46.9±10.8     <0.001   2054
Cardiovascular event                                  2.51%           4.72%           4.59%        0.161   2163
Days to cardiovascular event or end of follow-up 1728 [746;2767] 1617 [723;2596] 1775 [835;2723]   0.096   2163
Overall death                                         4.65%           11.0%           7.23%       <0.001   2148
Days to overall death or end of follow-up        1557 [812;2689] 1609 [734;2549] 1734 [817;2713]   0.249   2148
¯¯¯¯¯¯¯¯¯¯¯¯¯¯¯¯¯¯¯¯¯¯¯¯¯¯¯¯¯¯¯¯¯¯¯¯¯¯¯¯¯¯¯¯¯¯¯¯¯¯¯¯¯¯¯¯¯¯¯¯¯¯¯¯¯¯¯¯¯¯¯¯¯¯¯¯¯¯¯¯¯¯¯¯¯¯¯¯¯¯¯¯¯¯¯¯¯¯¯¯¯¯¯¯¯¯¯¯¯¯¯
If you want to change some bivariate table header, such “p-value”
instead of “p.overall” use header.labels argument:
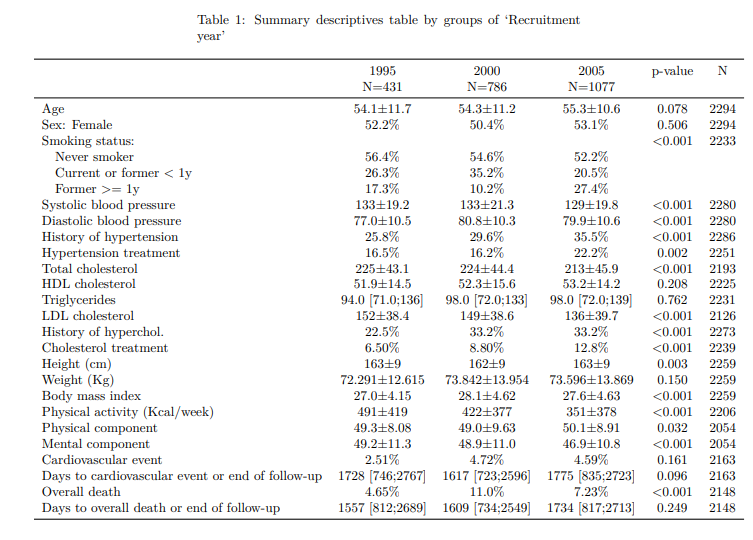
--------Summary descriptives table by 'Recruitment year'---------

_____________________________________________________________________________________________________________
                                                      1995            2000            2005       p-value  N
                                                      N=431           N=786          N=1077
¯¯¯¯¯¯¯¯¯¯¯¯¯¯¯¯¯¯¯¯¯¯¯¯¯¯¯¯¯¯¯¯¯¯¯¯¯¯¯¯¯¯¯¯¯¯¯¯¯¯¯¯¯¯¯¯¯¯¯¯¯¯¯¯¯¯¯¯¯¯¯¯¯¯¯¯¯¯¯¯¯¯¯¯¯¯¯¯¯¯¯¯¯¯¯¯¯¯¯¯¯¯¯¯¯¯¯¯¯
Age                                                 54.1±11.7       54.3±11.2       55.3±10.6     0.078  2294
Sex: Female                                           52.2%           50.4%           53.1%       0.506  2294
Smoking status:                                                                                  <0.001  2233
    Never smoker                                      56.4%           54.6%           52.2%
    Current or former < 1y                            26.3%           35.2%           20.5%
    Former >= 1y                                      17.3%           10.2%           27.4%
Systolic blood pressure                             133±19.2        133±21.3        129±19.8     <0.001  2280
Diastolic blood pressure                            77.0±10.5       80.8±10.3       79.9±10.6    <0.001  2280
History of hypertension                               25.8%           29.6%           35.5%      <0.001  2286
Hypertension treatment                                16.5%           16.2%           22.2%       0.002  2251
Total cholesterol                                   225±43.1        224±44.4        213±45.9     <0.001  2193
HDL cholesterol                                     51.9±14.5       52.3±15.6       53.2±14.2     0.208  2225
Triglycerides                                    94.0 [71.0;136] 98.0 [72.0;133] 98.0 [72.0;139]  0.762  2231
LDL cholesterol                                     152±38.4        149±38.6        136±39.7     <0.001  2126
History of hyperchol.                                 22.5%           33.2%           33.2%      <0.001  2273
Cholesterol treatment                                 6.50%           8.80%           12.8%      <0.001  2239
Height (cm)                                           163±9           162±9           163±9       0.003  2259
Weight (Kg)                                       72.291±12.615   73.842±13.954   73.596±13.869   0.150  2259
Body mass index                                     27.0±4.15       28.1±4.62       27.6±4.63    <0.001  2259
Physical activity (Kcal/week)                        491±419         422±377         351±378     <0.001  2206
Physical component                                  49.3±8.08       49.0±9.63       50.1±8.91     0.032  2054
Mental component                                    49.2±11.3       48.9±11.0       46.9±10.8    <0.001  2054
Cardiovascular event                                  2.51%           4.72%           4.59%       0.161  2163
Days to cardiovascular event or end of follow-up 1728 [746;2767] 1617 [723;2596] 1775 [835;2723]  0.096  2163
Overall death                                         4.65%           11.0%           7.23%      <0.001  2148
Days to overall death or end of follow-up        1557 [812;2689] 1609 [734;2549] 1734 [817;2713]  0.249  2148
¯¯¯¯¯¯¯¯¯¯¯¯¯¯¯¯¯¯¯¯¯¯¯¯¯¯¯¯¯¯¯¯¯¯¯¯¯¯¯¯¯¯¯¯¯¯¯¯¯¯¯¯¯¯¯¯¯¯¯¯¯¯¯¯¯¯¯¯¯¯¯¯¯¯¯¯¯¯¯¯¯¯¯¯¯¯¯¯¯¯¯¯¯¯¯¯¯¯¯¯¯¯¯¯¯¯¯¯¯
Exporting to different formats
- Word
Export to a Word.
export2word(restab, file = "example1.docx", header.labels = c(p.overall = "p-value"))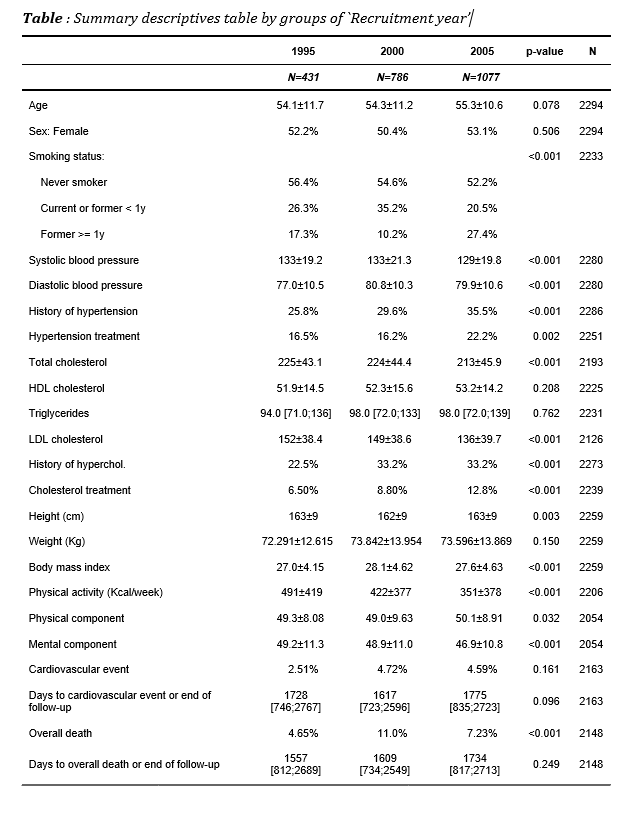
If you want to create a PDF document with the table in a publish-ready format
export2pdf(restab, file = "example1.pdf", header.labels = c(p.overall = "p-value"))
Note: To create tables in PDF you must have some LaTeX compiler installed on your computer.
- Excel
If you want export the descriptive table to an Excel file:
export2xls(restab, file = "example1.xlsx", header.labels = c(p.overall = "p-value"))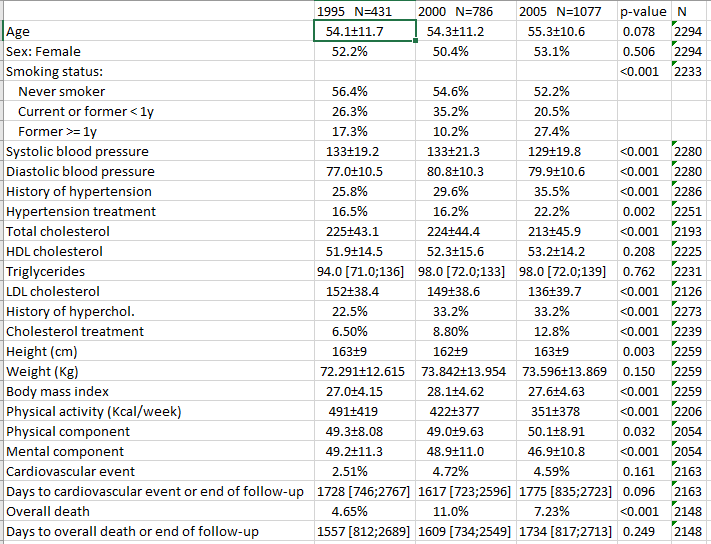
Note: You must have writexlR package
installed.
- Markdown
You can translate to Markdown code and insert it in a R-markdown chunk to create reproducible reports.
| 1995 | 2000 | 2005 | p-value | N | |
|---|---|---|---|---|---|
| N=431 | N=786 | N=1077 | |||
| Age | 54.1±11.7 | 54.3±11.2 | 55.3±10.6 | 0.078 | 2294 |
| Sex: Female | 52.2% | 50.4% | 53.1% | 0.506 | 2294 |
| Smoking status: | <0.001 | 2233 | |||
| Never smoker | 56.4% | 54.6% | 52.2% | ||
| Current or former < 1y | 26.3% | 35.2% | 20.5% | ||
| Former >= 1y | 17.3% | 10.2% | 27.4% | ||
| Systolic blood pressure | 133±19.2 | 133±21.3 | 129±19.8 | <0.001 | 2280 |
| Diastolic blood pressure | 77.0±10.5 | 80.8±10.3 | 79.9±10.6 | <0.001 | 2280 |
| History of hypertension | 25.8% | 29.6% | 35.5% | <0.001 | 2286 |
| Hypertension treatment | 16.5% | 16.2% | 22.2% | 0.002 | 2251 |
| Total cholesterol | 225±43.1 | 224±44.4 | 213±45.9 | <0.001 | 2193 |
| HDL cholesterol | 51.9±14.5 | 52.3±15.6 | 53.2±14.2 | 0.208 | 2225 |
| Triglycerides | 94.0 [71.0;136] | 98.0 [72.0;133] | 98.0 [72.0;139] | 0.762 | 2231 |
| LDL cholesterol | 152±38.4 | 149±38.6 | 136±39.7 | <0.001 | 2126 |
| History of hyperchol. | 22.5% | 33.2% | 33.2% | <0.001 | 2273 |
| Cholesterol treatment | 6.50% | 8.80% | 12.8% | <0.001 | 2239 |
| Height (cm) | 163±9 | 162±9 | 163±9 | 0.003 | 2259 |
| Weight (Kg) | 72.291±12.615 | 73.842±13.954 | 73.596±13.869 | 0.150 | 2259 |
| Body mass index | 27.0±4.15 | 28.1±4.62 | 27.6±4.63 | <0.001 | 2259 |
| Physical activity (Kcal/week) | 491±419 | 422±377 | 351±378 | <0.001 | 2206 |
| Physical component | 49.3±8.08 | 49.0±9.63 | 50.1±8.91 | 0.032 | 2054 |
| Mental component | 49.2±11.3 | 48.9±11.0 | 46.9±10.8 | <0.001 | 2054 |
| Cardiovascular event | 2.51% | 4.72% | 4.59% | 0.161 | 2163 |
| Days to cardiovascular event or end of follow-up | 1728 [746;2767] | 1617 [723;2596] | 1775 [835;2723] | 0.096 | 2163 |
| Overall death | 4.65% | 11.0% | 7.23% | <0.001 | 2148 |
| Days to overall death or end of follow-up | 1557 [812;2689] | 1609 [734;2549] | 1734 [817;2713] | 0.249 | 2148 |
- LaTeX
Similar to Markdown file, it is possible to insert LaTeX code in a .tex.
export2tex(restab, header.labels = c(p.overall = "p-value"))